


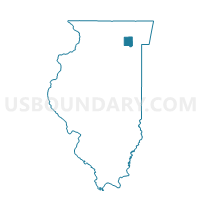
Downers Grove township, DuPage County, Illinois
About
Outline

Summary
| Unique Area Identifier | 126426 |
| Name | Downers Grove township |
| County | DuPage County |
| State | Illinois |
| Area (square miles) | 50.93 |
| Land Area (square miles) | 49.56 |
| Water Area (square miles) | 1.36 |
| % of Land Area | 97.32 |
| % of Water Area | 2.68 |
| Latitude of the Internal Point | 41.75447410 |
| Longtitude of the Internal Point | -87.97737640 |
| Total Population | 146,795 |
| Total Housing Units | 60,438 |
| Total Households | 56,866 |
| Median Age | 42 |
Maps


Graphs
Select a template below for downloading or customizing gragh for Downers Grove township, DuPage County, Illinois


Neighbors
Neighoring County Subdivision (by Name) Neighboring County Subdivision on the Map
- Du Page township, Will County, IL
- Lemont township, Cook County, IL
- Lisle township, DuPage County, IL
- Lyons township, Cook County, IL
- Milton township, DuPage County, IL
- Palos township, Cook County, IL
- Proviso township, Cook County, IL
- York township, DuPage County, IL
Top 10 Neighboring Place (by Population) Neighboring Place on the Map
- Bolingbrook village, IL (73,366)
- Downers Grove village, IL (47,833)
- Woodridge village, IL (32,971)
- Westmont village, IL (24,685)
- Darien city, IL (22,086)
- Hinsdale village, IL (16,816)
- Lemont village, IL (16,000)
- Burr Ridge village, IL (10,559)
- Willowbrook village, IL (8,540)
- Clarendon Hills village, IL (8,427)
Top 10 Neighboring Elementary School District (by Population) Neighboring Elementary School District on the Map
- Downers Grove Grade School District 58, IL (51,875)
- Woodridge School District 68, IL (32,571)
- Hinsdale Community Consolidated School District 181, IL (25,449)
- Lemont-Bromberek Combined School District 113A, IL (25,220)
- Maercker School District 60, IL (17,295)
- Darien School District 61, IL (16,556)
- Center Cass School District 66, IL (11,145)
- Western Springs School District 101, IL (10,175)
- Gower School District 62, IL (9,627)
- Cass School District 63, IL (8,331)
Top 10 Neighboring Secondary School District (by Population) Neighboring Secondary School District on the Map
- Consolidated High School District 230, IL (155,955)
- Community High School District 99, IL (109,523)
- Hinsdale Township High School District 86, IL (74,146)
- Lyons Township High School District 204, IL (68,725)
- Lemont Township High School District 210, IL (25,565)
Top 10 Neighboring Unified School District (by Population) Neighboring Unified School District on the Map
- Valley View Community Unit School District 365U, IL (92,516)
- Westmont Community Unit School District 201, IL (12,549)
Top 10 Neighboring State Legislative District Lower Chamber (by Population) Neighboring State Legislative District Lower Chamber on the Map
- State House District 85, IL (139,496)
- State House District 82, IL (108,906)
- State House District 42, IL (106,361)
- State House District 35, IL (105,864)
- State House District 41, IL (102,941)
- State House District 47, IL (102,695)
Top 10 Neighboring State Legislative District Upper Chamber (by Population) Neighboring State Legislative District Upper Chamber on the Map
- State Senate District 43, IL (252,892)
- State Senate District 41, IL (250,942)
- State Senate District 21, IL (209,302)
- State Senate District 18, IL (209,148)
- State Senate District 24, IL (207,806)
Top 10 Neighboring 111th Congressional District (by Population) Neighboring 111th Congressional District on the Map
- Congressional District 13, IL (773,095)
- Congressional District 3, IL (663,381)
- Congressional District 6, IL (657,131)
Top 10 Neighboring Census Tract (by Population) Neighboring Census Tract on the Map
- Census Tract 8202.01, Cook County, IL (7,827)
- Census Tract 8201.01, Cook County, IL (6,937)
- Census Tract 8451, DuPage County, IL (6,345)
- Census Tract 8458.07, DuPage County, IL (6,197)
- Census Tract 8238.01, Cook County, IL (5,716)
- Census Tract 8447.02, DuPage County, IL (5,609)
- Census Tract 8240.05, Cook County, IL (5,539)
- Census Tract 8801.09, Will County, IL (5,469)
- Census Tract 8458.03, DuPage County, IL (5,427)
- Census Tract 8240.04, Cook County, IL (5,371)
Top 10 Neighboring 5-Digit ZIP Code Tabulation Area (by Population) Neighboring 5-Digit ZIP Code Tabulation Area on the Map
- 60440, IL (52,911)
- 60517, IL (32,038)
- 60516, IL (29,084)
- 60515, IL (27,503)
- 60527, IL (27,486)
- 60559, IL (24,852)
- 60561, IL (23,115)
- 60439, IL (22,919)
- 60521, IL (17,597)
- 60558, IL (12,960)
Data
Demographic, Population, Households, and Housing Units
** Data sources from census 2010 **
Show Data on Map
Download Full List as CSV
Download Quick Sheet as CSV
| Subject | This Area | DuPage County | Illinois | National |
|---|---|---|---|---|
| POPULATION | ||||
| Total Population Map | 146,795 | 916,924 | 12,830,632 | 308,745,538 |
| POPULATION, HISPANIC OR LATINO ORIGIN | ||||
| Not Hispanic or Latino Map | 137,203 | 795,418 | 10,803,054 | 258,267,944 |
| Hispanic or Latino Map | 9,592 | 121,506 | 2,027,578 | 50,477,594 |
| POPULATION, RACE | ||||
| White alone Map | 120,977 | 714,140 | 9,177,877 | 223,553,265 |
| Black or African American alone Map | 6,802 | 42,346 | 1,866,414 | 38,929,319 |
| American Indian and Alaska Native alone Map | 224 | 2,415 | 43,963 | 2,932,248 |
| Asian alone Map | 13,406 | 92,304 | 586,934 | 14,674,252 |
| Native Hawaiian and Other Pacific Islander alone Map | 32 | 217 | 4,050 | 540,013 |
| Some Other Race alone Map | 2,535 | 45,106 | 861,412 | 19,107,368 |
| Two or More Races Map | 2,819 | 20,396 | 289,982 | 9,009,073 |
| POPULATION, SEX | ||||
| Male Map | 70,834 | 449,351 | 6,292,276 | 151,781,326 |
| Female Map | 75,961 | 467,573 | 6,538,356 | 156,964,212 |
| POPULATION, AGE (18 YEARS) | ||||
| 18 years and over Map | 111,211 | 689,494 | 9,701,453 | 234,564,071 |
| Under 18 years | 35,584 | 227,430 | 3,129,179 | 74,181,467 |
| POPULATION, AGE | ||||
| Under 5 years | 8,228 | 56,940 | 835,577 | 20,201,362 |
| 5 to 9 years | 9,779 | 62,430 | 859,405 | 20,348,657 |
| 10 to 14 years | 10,682 | 65,875 | 879,448 | 20,677,194 |
| 15 to 17 years | 6,895 | 42,185 | 554,749 | 12,954,254 |
| 18 and 19 years | 3,001 | 23,134 | 367,343 | 9,086,089 |
| 20 years | 1,254 | 10,189 | 179,613 | 4,519,129 |
| 21 years | 1,199 | 9,888 | 172,795 | 4,354,294 |
| 22 to 24 years | 4,541 | 34,420 | 526,556 | 12,712,576 |
| 25 to 29 years | 7,737 | 60,280 | 910,273 | 21,101,849 |
| 30 to 34 years | 7,424 | 56,942 | 865,684 | 19,962,099 |
| 35 to 39 years | 8,592 | 59,678 | 855,790 | 20,179,642 |
| 40 to 44 years | 10,373 | 66,301 | 870,100 | 20,890,964 |
| 45 to 49 years | 12,346 | 74,816 | 940,094 | 22,708,591 |
| 50 to 54 years | 12,931 | 74,326 | 930,785 | 22,298,125 |
| 55 to 59 years | 11,520 | 62,885 | 807,778 | 19,664,805 |
| 60 and 61 years | 3,913 | 21,531 | 284,180 | 7,113,727 |
| 62 to 64 years | 5,344 | 28,706 | 381,249 | 9,704,197 |
| 65 and 66 years | 2,797 | 14,855 | 205,270 | 5,319,902 |
| 67 to 69 years | 3,954 | 19,547 | 279,790 | 7,115,361 |
| 70 to 74 years | 4,661 | 23,238 | 364,475 | 9,278,166 |
| 75 to 79 years | 3,447 | 17,905 | 289,385 | 7,317,795 |
| 80 to 84 years | 2,915 | 14,980 | 235,381 | 5,743,327 |
| 85 years and over | 3,262 | 15,873 | 234,912 | 5,493,433 |
| MEDIAN AGE BY SEX | ||||
| Both sexes Map | 42.00 | 38.20 | 36.60 | 37.20 |
| Male Map | 40.50 | 36.60 | 35.20 | 35.80 |
| Female Map | 43.40 | 39.50 | 37.90 | 38.50 |
| HOUSEHOLDS | ||||
| Total Households Map | 56,866 | 337,132 | 4,836,972 | 116,716,292 |
| HOUSEHOLDS, HOUSEHOLD TYPE | ||||
| Family households: Map | 39,680 | 238,014 | 3,182,984 | 77,538,296 |
| Husband-wife family Map | 32,645 | 193,232 | 2,332,995 | 56,510,377 |
| Other family: Map | 7,035 | 44,782 | 849,989 | 21,027,919 |
| Male householder, no wife present Map | 1,772 | 12,847 | 227,684 | 5,777,570 |
| Female householder, no husband present Map | 5,263 | 31,935 | 622,305 | 15,250,349 |
| Nonfamily households: Map | 17,186 | 99,118 | 1,653,988 | 39,177,996 |
| Householder living alone Map | 14,867 | 81,763 | 1,346,312 | 31,204,909 |
| Householder not living alone Map | 2,319 | 17,355 | 307,676 | 7,973,087 |
| HOUSEHOLDS, HISPANIC OR LATINO ORIGIN OF HOUSEHOLDER | ||||
| Not Hispanic or Latino householder: Map | 54,331 | 307,666 | 4,329,737 | 103,254,926 |
| Hispanic or Latino householder: Map | 2,535 | 29,466 | 507,235 | 13,461,366 |
| HOUSEHOLDS, RACE OF HOUSEHOLDER | ||||
| Householder who is White alone | 48,546 | 278,055 | 3,680,912 | 89,754,352 |
| Householder who is Black or African American alone | 2,566 | 15,575 | 668,152 | 14,129,983 |
| Householder who is American Indian and Alaska Native alone | 75 | 616 | 13,449 | 939,707 |
| Householder who is Asian alone | 4,428 | 27,894 | 192,603 | 4,632,164 |
| Householder who is Native Hawaiian and Other Pacific Islander alone | 10 | 73 | 1,278 | 143,932 |
| Householder who is Some Other Race alone | 652 | 10,714 | 213,509 | 4,916,427 |
| Householder who is Two or More Races | 589 | 4,205 | 67,069 | 2,199,727 |
| HOUSEHOLDS, HOUSEHOLD TYPE BY HOUSEHOLD SIZE | ||||
| Family households: Map | 39,680 | 238,014 | 3,182,984 | 77,538,296 |
| 2-person household Map | 16,092 | 89,307 | 1,259,669 | 31,882,616 |
| 3-person household Map | 9,118 | 54,556 | 720,213 | 17,765,829 |
| 4-person household Map | 8,658 | 53,718 | 644,972 | 15,214,075 |
| 5-person household Map | 4,033 | 25,636 | 326,688 | 7,411,997 |
| 6-person household Map | 1,250 | 9,340 | 132,759 | 3,026,278 |
| 7-or-more-person household Map | 529 | 5,457 | 98,683 | 2,237,501 |
| Nonfamily households: Map | 17,186 | 99,118 | 1,653,988 | 39,177,996 |
| 1-person household Map | 14,867 | 81,763 | 1,346,312 | 31,204,909 |
| 2-person household Map | 2,038 | 14,825 | 250,239 | 6,360,012 |
| 3-person household Map | 173 | 1,542 | 36,254 | 992,156 |
| 4-person household Map | 73 | 690 | 14,759 | 411,171 |
| 5-person household Map | 21 | 189 | 3,959 | 126,634 |
| 6-person household Map | 12 | 72 | 1,433 | 48,421 |
| 7-or-more-person household Map | 2 | 37 | 1,032 | 34,693 |
| HOUSING UNITS | ||||
| Total Housing Units Map | 60,438 | 356,179 | 5,296,715 | 131,704,730 |
| HOUSING UNITS, OCCUPANCY STATUS | ||||
| Occupied Map | 56,866 | 337,132 | 4,836,972 | 116,716,292 |
| Vacant Map | 3,572 | 19,047 | 459,743 | 14,988,438 |
| HOUSING UNITS, OCCUPIED, TENURE | ||||
| Owned with a mortgage or a loan Map | 31,516 | 193,534 | 2,338,493 | 52,979,430 |
| Owned free and clear Map | 12,486 | 58,301 | 925,146 | 23,006,644 |
| Renter occupied Map | 12,864 | 85,297 | 1,573,333 | 40,730,218 |
| HOUSING UNITS, VACANT, VACANCY STATUS | ||||
| For rent Map | 1,126 | 7,390 | 158,882 | 4,137,567 |
| Rented, not occupied Map | 67 | 374 | 7,998 | 206,825 |
| For sale only Map | 1,018 | 5,199 | 82,739 | 1,896,796 |
| Sold, not occupied Map | 238 | 854 | 16,677 | 421,032 |
| For seasonal, recreational, or occasional use Map | 357 | 1,646 | 47,289 | 4,649,298 |
| For migrant workers Map | 0 | 11 | 315 | 24,161 |
| Other vacant Map | 766 | 3,573 | 145,843 | 3,652,759 |
| HOUSING UNITS, OCCUPIED, AVERAGE HOUSEHOLD SIZE BY TENURE | ||||
| Total: Map | 2.56 | 2.68 | 2.59 | 2.58 |
| Owner occupied Map | 2.65 | 2.79 | 2.69 | 2.65 |
| Renter occupied Map | 2.26 | 2.36 | 2.38 | 2.44 |
| HOUSING UNITS, OCCUPIED, TENURE BY RACE OF HOUSEHOLDER | ||||
| Owner occupied: Map | 44,002 | 251,835 | 3,263,639 | 75,986,074 |
| Householder who is White alone Map | 39,473 | 218,640 | 2,728,000 | 63,446,275 |
| Householder who is Black or African American alone Map | 502 | 4,356 | 272,489 | 6,261,464 |
| Householder who is American Indian and Alaska Native alone Map | 40 | 324 | 6,873 | 509,588 |
| Householder who is Asian alone Map | 3,360 | 20,952 | 118,649 | 2,688,861 |
| Householder who is Native Hawaiian and Other Pacific Islander alone Map | 4 | 32 | 644 | 61,911 |
| Householder who is Some Other Race alone Map | 285 | 5,111 | 103,641 | 1,975,817 |
| Householder who is Two or More Races Map | 338 | 2,420 | 33,343 | 1,042,158 |
| Renter occupied: Map | 12,864 | 85,297 | 1,573,333 | 40,730,218 |
| Householder who is White alone Map | 9,073 | 59,415 | 952,912 | 26,308,077 |
| Householder who is Black or African American alone Map | 2,064 | 11,219 | 395,663 | 7,868,519 |
| Householder who is American Indian and Alaska Native alone Map | 35 | 292 | 6,576 | 430,119 |
| Householder who is Asian alone Map | 1,068 | 6,942 | 73,954 | 1,943,303 |
| Householder who is Native Hawaiian and Other Pacific Islander alone Map | 6 | 41 | 634 | 82,021 |
| Householder who is Some Other Race alone Map | 367 | 5,603 | 109,868 | 2,940,610 |
| Householder who is Two or More Races Map | 251 | 1,785 | 33,726 | 1,157,569 |
| HOUSING UNITS, OCCUPIED, TENURE BY HISPANIC OR LATINO ORIGIN OF HOUSEHOLDER | ||||
| Owner occupied: Map | 44,002 | 251,835 | 3,263,639 | 75,986,074 |
| Not Hispanic or Latino householder Map | 42,672 | 235,910 | 2,996,581 | 69,617,625 |
| Hispanic or Latino householder Map | 1,330 | 15,925 | 267,058 | 6,368,449 |
| Renter occupied: Map | 12,864 | 85,297 | 1,573,333 | 40,730,218 |
| Not Hispanic or Latino householder Map | 11,659 | 71,756 | 1,333,156 | 33,637,301 |
| Hispanic or Latino householder Map | 1,205 | 13,541 | 240,177 | 7,092,917 |
| HOUSING UNITS, OCCUPIED, TENURE BY HOUSEHOLD SIZE | ||||
| Owner occupied: Map | 44,002 | 251,835 | 3,263,639 | 75,986,074 |
| 1-person household Map | 9,775 | 49,915 | 732,688 | 16,453,569 |
| 2-person household Map | 14,680 | 80,972 | 1,111,442 | 27,618,605 |
| 3-person household Map | 7,379 | 43,681 | 529,763 | 12,517,563 |
| 4-person household Map | 7,355 | 44,864 | 493,300 | 10,998,793 |
| 5-person household Map | 3,402 | 21,037 | 238,851 | 5,057,765 |
| 6-person household Map | 1,024 | 7,358 | 92,193 | 1,965,796 |
| 7-or-more-person household Map | 387 | 4,008 | 65,402 | 1,373,983 |
| Renter occupied: Map | 12,864 | 85,297 | 1,573,333 | 40,730,218 |
| 1-person household Map | 5,092 | 31,848 | 613,624 | 14,751,340 |
| 2-person household Map | 3,450 | 23,160 | 398,466 | 10,624,023 |
| 3-person household Map | 1,912 | 12,417 | 226,704 | 6,240,422 |
| 4-person household Map | 1,376 | 9,544 | 166,431 | 4,626,453 |
| 5-person household Map | 652 | 4,788 | 91,796 | 2,480,866 |
| 6-person household Map | 238 | 2,054 | 41,999 | 1,108,903 |
| 7-or-more-person household Map | 144 | 1,486 | 34,313 | 898,211 |
Loading...